
For decades, voter turnout and political mobilization have been primary focuses for candidates, campaigns, advocacy organizations, and scholars alike. Both in the runup and the aftermath of US elections, scholars and political actors use exit polling data to draw conclusions about voting trends and the country’s political participation. And although broad trends for civic engagement are promising, the full story is more nuanced – demographic breakdowns suggest a divide exists between the oldest and youngest electorates. But before diving into the more nuanced data, let’s learn more about midterm and presidential elections.
The U.S. Census Bureau data reports that 155 million citizens voted in the 2020 presidential election (66.8% of voting-eligible Americans). In 2022, just 107.7 million cast a ballot (45.1% of voting-eligible Americans).1“2020 Presidential Election Voting and Registration Tables Now Available.” US Census Bureau, 29 Apr. 2021, https://www.census.gov/newsroom/press-releases/2021/2020-presidential-election-voting-and-registration-tables-now-available.html. Although these figures may seem low, 2020 and 2022 featured some of the highest voter turnout rates of the last several decades.
Midterm electorates are smaller, older, and less diverse than presidential ones, but the demographic voting patters and divisions that we see in midterms are quite similar to presidential contests.
UVA Center for Politics, Edited by Geoffrey Skelley and Kyle Kondik
Although the data indicates that overall voter turnout is increasing, that may not be the full story. Demographic trends in civic engagement suggest that groups of people are participating in different ways depending on their cohorts (age, race, ethnicity, class, etc.). In this study, we’re interested in age as a potential motivator for voter behavior. More specifically, we approach this topic through the lens of college students’ political participation.
Presidential Elections
But first, let’s look at recent trends in presidential election years. The Center for Information and Research on Civic Learning and Engagement (CIRCLE) at Tufts University estimates that 50% of young people, defined as those ages 18-29, cast a ballot in the 2020 election. This figure represents a dramatic 11-point increase in this cohort’s turnout when compared to the 2016 election, and it is one of the highest rates of engagement for young people since the voting age was lowered to 18 in 1971.2“2020 Election Center.” Center for Information and Research on Civic Learning and Engagement (CIRCLE) at Tufts University, https://circle.tufts.edu/2020-election-center. Accessed 23 Apr. 2023.
To help visualize these trends, Bloomberg Government published several bar graphs displaying voter turnout across all eligible age cohorts. Although they define the young adult cohort as 18-24-year-olds, the general trends remain consistent — midterm turnout is lower overall, but engagement continues to increase between election cycles.3“Election Demographics and Voter Turnout: Breaking down Demographic Data, the Diversifying U.S. Population, and What It Means for the 2022 Elections and Beyond.” Bloomberg Government, 13 July 2022, https://about.bgov.com/brief/election-demographics-and-voter-turnout/.
2016 & 2020 Presidential Election Voter Turnout
Although young adult participation rates are increasing overall, other demographic cohorts within this age bracket can have an effect on engagement. For the purposes of this study, we hone in on college students as a way to better understand participation trends in the Davidson community. In doing so, we rely on other work conducted at Tufts, being their National Study of Learning, Voting, and Engagement (NSLVE). NSLVE “offers colleges and universities an opportunity to learn their student registration and voting rates and, for interested campuses, a closer examination of their campus climate for political learning and engagement.” In 2020, NSLVE determined that the national student voting rate was 66%, a 14% increase from that same figure in 2016. These findings are critical for this study as they identify a cohort of young adults — students enrolled in higher education institutions — that voted at a rate 16% higher than the national average for this age group.4“The National Study of Learning, Voting, and Engagement (NSLVE).” Institute for Democracy & Higher Education at Tufts University, https://idhe.tufts.edu/nslve. Accessed 27 Mar. 2023. As we analyze Davidson College student voting trends, it is crucial to put our community’s numbers in conversation with trends of the same cohort. Learn why this comparison is important on our Davidson Voting page.
Midterm Elections
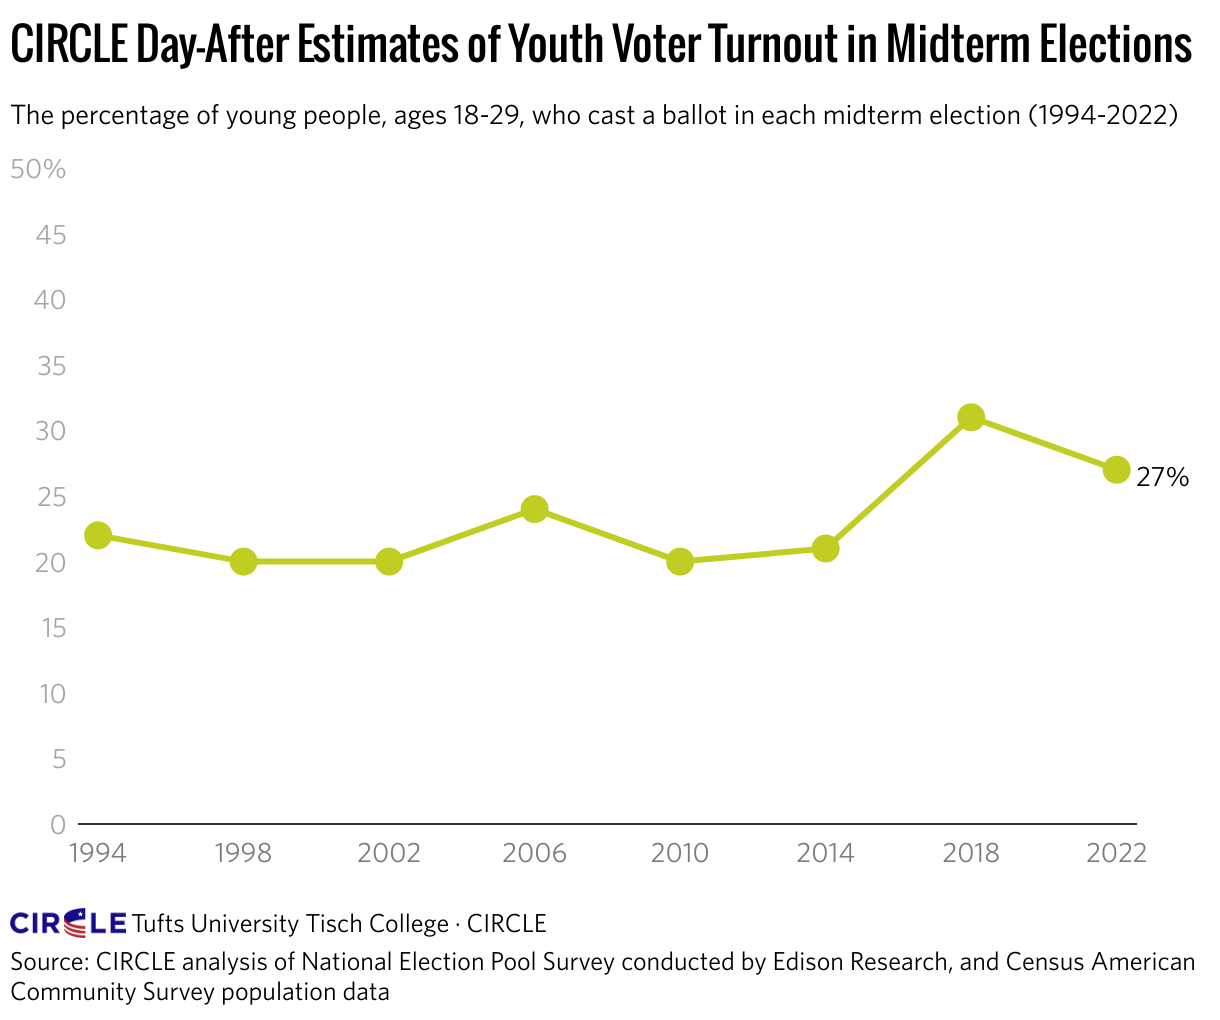
If we know presidential elections are drawing the most voters, what’s happening in midterms? Among almost all cohorts, overall turnout for midterm elections is notably lower. In November 2022, 27% of youth voters cast ballots, the second highest turnout from that age group in a midterm election in 30 years. At a rate of 31%, only 2018’s midterm was higher. Despite these historically high turnout rates, there is still a stark difference in civic engagement statistics between midterm and presidential elections. Simply put, 23% fewer young adults voted in an election just two years after 2020’s unprecedented rates.5“Millions of Youth Cast Ballots, Decide Key 2022 Races.” Center for Information and Research on Civic Learning and Engagement (CIRCLE), 9 Nov. 2022, https://circle.tufts.edu/latest-research/millions-youth-cast-ballots-decide-key-2022-races. Compare the following graph produced by Bloomberg Government with the one above to help visualize differences in voter turnout between midterm and presidential years.6“Election Demographics and Voter Turnout: Breaking down Demographic Data, the Diversifying U.S. Population, and What It Means for the 2022 Elections and Beyond.” Bloomberg Government, 13 July 2022, https://about.bgov.com/brief/election-demographics-and-voter-turnout/.
2014 & 2018 Midterm Election Voter Turnout
CIRCLE at Tufts produced the following visualization, highlighting trends in youth voter turnout across the past 8 midterm election cycles.7“Millions of Youth Cast Ballots, Decide Key 2022 Races.” Center for Information and Research on Civic Learning and Engagement (CIRCLE), 9 Nov. 2022, https://circle.tufts.edu/latest-research/millions-youth-cast-ballots-decide-key-2022-races.
Just as we did with the presidential election data, here we focus on NSLVE’s college-specific data as to set a threshold for which we can compare our own. Although the organization has yet to release reports on the 2022 midterm election, the 2018 data is readily available. In that election, the national student voting rate sat at 40.3%, with 55% of registered students hitting the polls.8Institute for Democracy & Higher Education: National Study of Learning, Voting and Engagement. (2022). 2014, 2018, and 2020 report for Davidson College. Medford, MA. Here, the yield rate statistic — the number of registered student voters who then cast a vote — is important. In the 2020 presidential election, the yield rate for college students was 80%, a 25% difference from the midterm two years prior.9Institute for Democracy & Higher Education: National Study of Learning, Voting and Engagement. (2021). 2016, 2018, and 2020 report for Davidson College. Medford, MA. This data shows that not only are fewer people voting in midterm elections, but even among registered voters the participation rates are significantly lower. To read more from Tufts University’s NSLVE, navigate to either the organization’s 2020 national report or the 2018 national report.
What does this really mean?
Although the 2022 exit-polling statistics mark youth turnout in a midterm election at the second highest level in almost 30 years, political scientists can’t seem to agree on the message or story derived therein. Typically, they fall into one of two camps: those who see this demographic data as a push in the right direction and commend the young electorate for its impact, and those who see this election as another example of disappointing civic engagement from the youngest voting bloc.10“Millions of Youth Cast Ballots, Decide Key 2022 Races.” Center for Information and Research on Civic Learning and Engagement (CIRCLE), 9 Nov. 2022, https://circle.tufts.edu/latest-research/millions-youth-cast-ballots-decide-key-2022-races.
The Cynics
Scholars like Bhatti et al., Pultzer, and Khalid fall among the cynics who see the trends as disappointing, as their work portrays the current demographic voting trends in a negative light and offers explanations. They write that “contrary to common belief, the relationship between age and turnout among the youngest eligible individuals is not monotonically positive, but rather strongly negative.”11Bhatti, Yosef, and Kasper M. Hansen. “Leaving the Nest and the Social Act of Voting: Turnout among First-Time Voters.” Journal of Elections, Public Opinion & Parties, vol. 22, no. 4, Nov. 2012, pp. 380–406. DOI.org (Crossref), https://doi.org/10.1080/17457289.2012.721375. But more so than the data itself, Bhatti and Hansen are concerned with the story behind the trends. They view voting as an inherently social endeavor, meaning that “the primary social network the citizen is engaged in heavily influences whether she turns out or not.” As citizens enter their first years of voting eligibility, they are still living with parents or guardians, those who are more likely to have established consistent voting habits. But when young adults “move out,” their new social network does not typically possess the same voting patterns, leading to a sharp decline in participation rates for college-aged individuals.12Bhatti, Yosef, and Kasper M. Hansen. “Leaving the Nest and the Social Act of Voting: Turnout among First-Time Voters.” Journal of Elections, Public Opinion & Parties, vol. 22, no. 4, Nov. 2012, pp. 380–406. DOI.org (Crossref), https://doi.org/10.1080/17457289.2012.721375. Bhatti et al. explain young-adult voter trends from a social angle, but the underlying theme persists – people ages 18-29 are voting at lower clips than any other eligible bloc, and there must be a reason why.
The primary social network the citizen is engaged in heavily influences whether she turns out or not.
Bhatti and Hansen, “Leaving the Nest and the Social Act of Voting”
Other scholars approach youth engagement from a similarly negative angle while providing other explanations for the poor turnout. Eric Pultzer describes low participation from the youngest electorate as a product of inertia, where citizens are increasingly likely to vote in subsequent elections when the habit has formed in previous ones. Therefore, younger voters are less likely to have formed strong voting habits and/or shouldered the costs of voting, resulting in a portion of the population with less inertia for future voting. Every time someone votes, the costs of voting in the future decrease, habitual voting habits are born, and political participation increases over time.13Plutzer, Eric. “Becoming a Habitual Voter: Inertia, Resources, and Growth in Young Adulthood.” American Political Science Review, vol. 96, no. 1, Mar. 2002, pp. 41–56. DOI.org (Crossref), https://doi.org/10.1017/S0003055402004227. At least that’s what Pultzer theorizes. Other scholars see low youth engagement as a product of accumulating costs — time, political knowledge, transportation, etc. — that serve as a significant deterrent to voting.
Asma Khalid and her colleagues at NPR took a closer look at college students, finding that a host of misperceptions keep the youngest electorate removed from the political process. Their research found that nearly 20 percent of working-class youth “said they don’t think they know enough to be able to vote,” most feel it is an ineffective means for change, and some even thought a DUI meant they were ineligible to participate.14Khalid, Asma, et al. “On The Sidelines Of Democracy: Exploring Why So Many Americans Don’t Vote.” NPR, 10 Sept. 2018. NPR, https://www.npr.org/2018/09/10/645223716/on-the-sidelines-of-democracy-exploring-why-so-many-americans-dont-vote. Not only are these misperceptions a significant deterrent, but rapid location change is also a factor. As young adults move away from home, many feel disengaged from their local politics, are unsure how to reregister in their new location or lack knowledge on how to request an absentee ballot. The costs investigated by Khalid et al. are felt in large part by the youngest voting blocs, which can help explain why such a stark gap exists between old and young voter behavior.
The Optimists
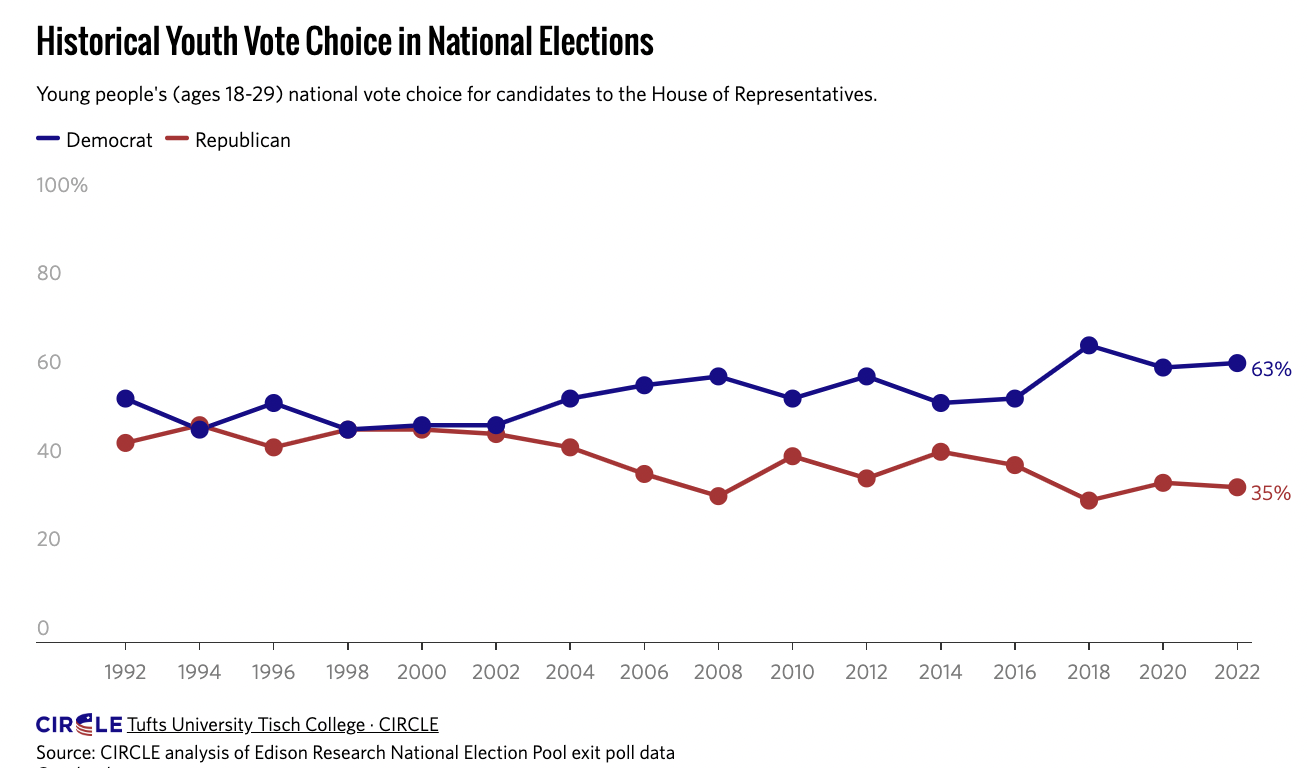
As discussed in CIRCLE’s study, 2022 continued the positive trend in youth midterm participation. “After hovering around 20% turnout in midterm elections since the 1990s, young people shifted that trend in 2018 and largely maintained that trend in 2022, with more than a quarter of young people casting a ballot.”15“Millions of Youth Cast Ballots, Decide Key 2022 Races.” Center for Information and Research on Civic Learning and Engagement (CIRCLE), 9 Nov. 2022, https://circle.tufts.edu/latest-research/millions-youth-cast-ballots-decide-key-2022-races. While there exists a breadth of scholarship explaining why youth voter turnout is comparatively low, there are also scholars who identify upward trends in the polling data and seek to identify the factors which are increasingly motivating young adults to the polls. Although the overall figure may be lower than other age groups, CIRCLE identifies young adult participation as a key factor in deterring the “red wave,” a term coined by conservative pundits who wrongly predicted a clean sweep of Republican victories in 2022. With findings derived from exit polling data from House of Representatives elections, researchers found that young adults preferred Democratic candidates by a 28-point margin, and they asserted that the impact was felt significantly in battleground states.16“Millions of Youth Cast Ballots, Decide Key 2022 Races.” Center for Information and Research on Civic Learning and Engagement (CIRCLE), 9 Nov. 2022, https://circle.tufts.edu/latest-research/millions-youth-cast-ballots-decide-key-2022-races. Some political scientists attribute this divide to the election’s most pressing issues. For example, young voters cited abortion rights as their number one issue in 2022, and no other age group prioritized it similarly.
After hovering around 20% turnout in midterm elections since the 1990s, young people shifted that trend in 2018 and largely maintained that trend in 2022, with more than a quarter of young people casting a ballot.
CIRCLE, Tufts University
Other work echoes a similar sentiment regarding youth turnout, one that highlights the impact of the age group’s participation and considers implications for future elections. William Frey at the Brookings Institute underscores the same trends as those discussed by CIRCLE, while also drawing conclusions for Democrats post-election. He writes that “For a variety of reasons—including concerns about abortion, inclusivity, democracy, and education—it seems likely that Gen Z and young millennials will become the future core of the Democratic coalition.” Frey makes these assertions based on exit polling data highlighting the overwhelming support young people showed Democratic candidates. He argues that as the youngest voting bloc continues to age, Democrats should be optimistic given that their values align closely with those of the generations that comprise “youth voters” in 2022.17Frey, William H. “Midterm Exit Polls Show That Young Voters Drove Democratic Resistance to the ‘Red Wave.’” Brookings, 18 Nov. 2022, https://www.brookings.edu/research/midterm-exit-polls-show-that-young-voters-drove-democratic-resistance-to-the-red-wave/.
The current field of scholarly work regarding youth voter turnout is extensive yet mixed. While some view sub-30% midterm participation as abysmal and in need of immediate improvement, others look for silver linings in the data. Using Davidson as a case study for these issues, this project draws on the explanations developed by scholars like Bhatti and Pultzer to help explain trends on campus. Furthermore, we use data-driven studies published by CIRCLE and Brookings to help contextualize our own community’s civic engagement. Without aligning our community’s data with either camp, we draw out important and applicable explanations from the existing body of research, apply them to Davidson’s voting patterns in past years, and engage with civic leaders on campus to provide potential paths forward for a more politically-engaged campus.