How does Davidson vote?
Before diving into the NSLVE data, let’s first discuss how it is being benchmarked. Simply comparing Davidson students to broad national averages is relatively unproductive. Based on the national data, we know that younger voters do not participate (on average) at rates consistent with retirees, for example. Students typically belong to the youngest eligible cohort of voters, so putting their rates in conversation with others their age will produce a more meaningful analysis.
But, if our goal is to assess Davidson College’s campus engagement, even more specificity is necessary. Among youth voters, those enrolled in higher education institutions are more likely to be politically engaged, surrounded by resources, and often encouraged to cast a ballot. Therefore, Davidson’s success in motivating its students should be measured against other higher education institutions, rather than simply contrasting college students with non-college youth. So, that is precisely what NSLVE did in their work, and their data is shown below.
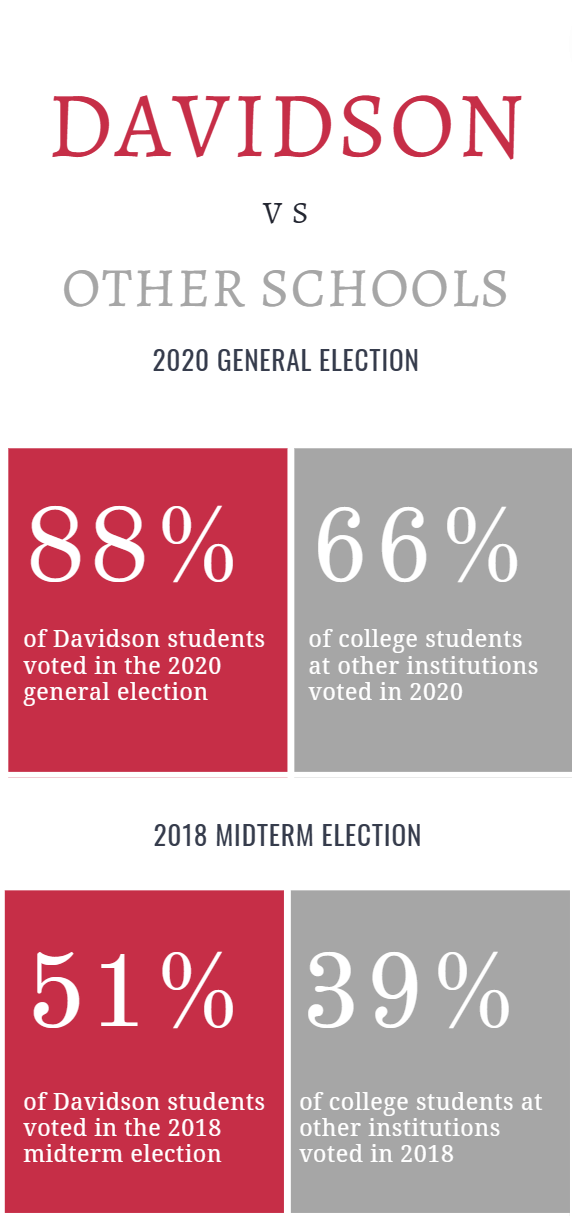
On average, Davidson students are voting at extremely high rates. In 2022, Wildcats surpassed the national average for college students at other institutions (a rate that is already much higher than the unenrolled youth rates) by a staggering 22%. In 2018, that difference was 12%.1Institute for Democracy & Higher Education: National Study of Learning, Voting and Engagement. (2021). 2016, 2018, and 2020 report for Davidson College. Medford, MA. Here are some more graphs from NSLVE’s 2020 and 2018 campus reports to highlight that disparity.
How to read the charts
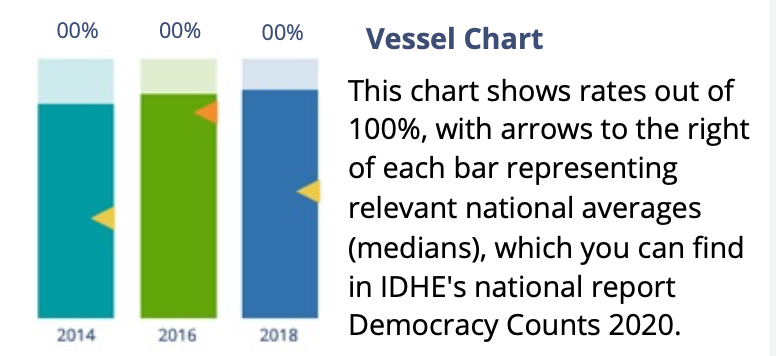
The relevant national averages in the graphs below are compiled from the nationally-representative sample of higher education institutions included in the NSLVE reports. Their data includes 1,200 participating colleges and universities, 10 million student records, and representation from all 50 states.2“The National Study of Learning, Voting, and Engagement (NSLVE).” Institute for Democracy & Higher Education at Tufts University, https://idhe.tufts.edu/nslve. Accessed 27 Mar. 2023. Navigate to NSLVE’s site to learn more.
Davidson’s 2020 Data
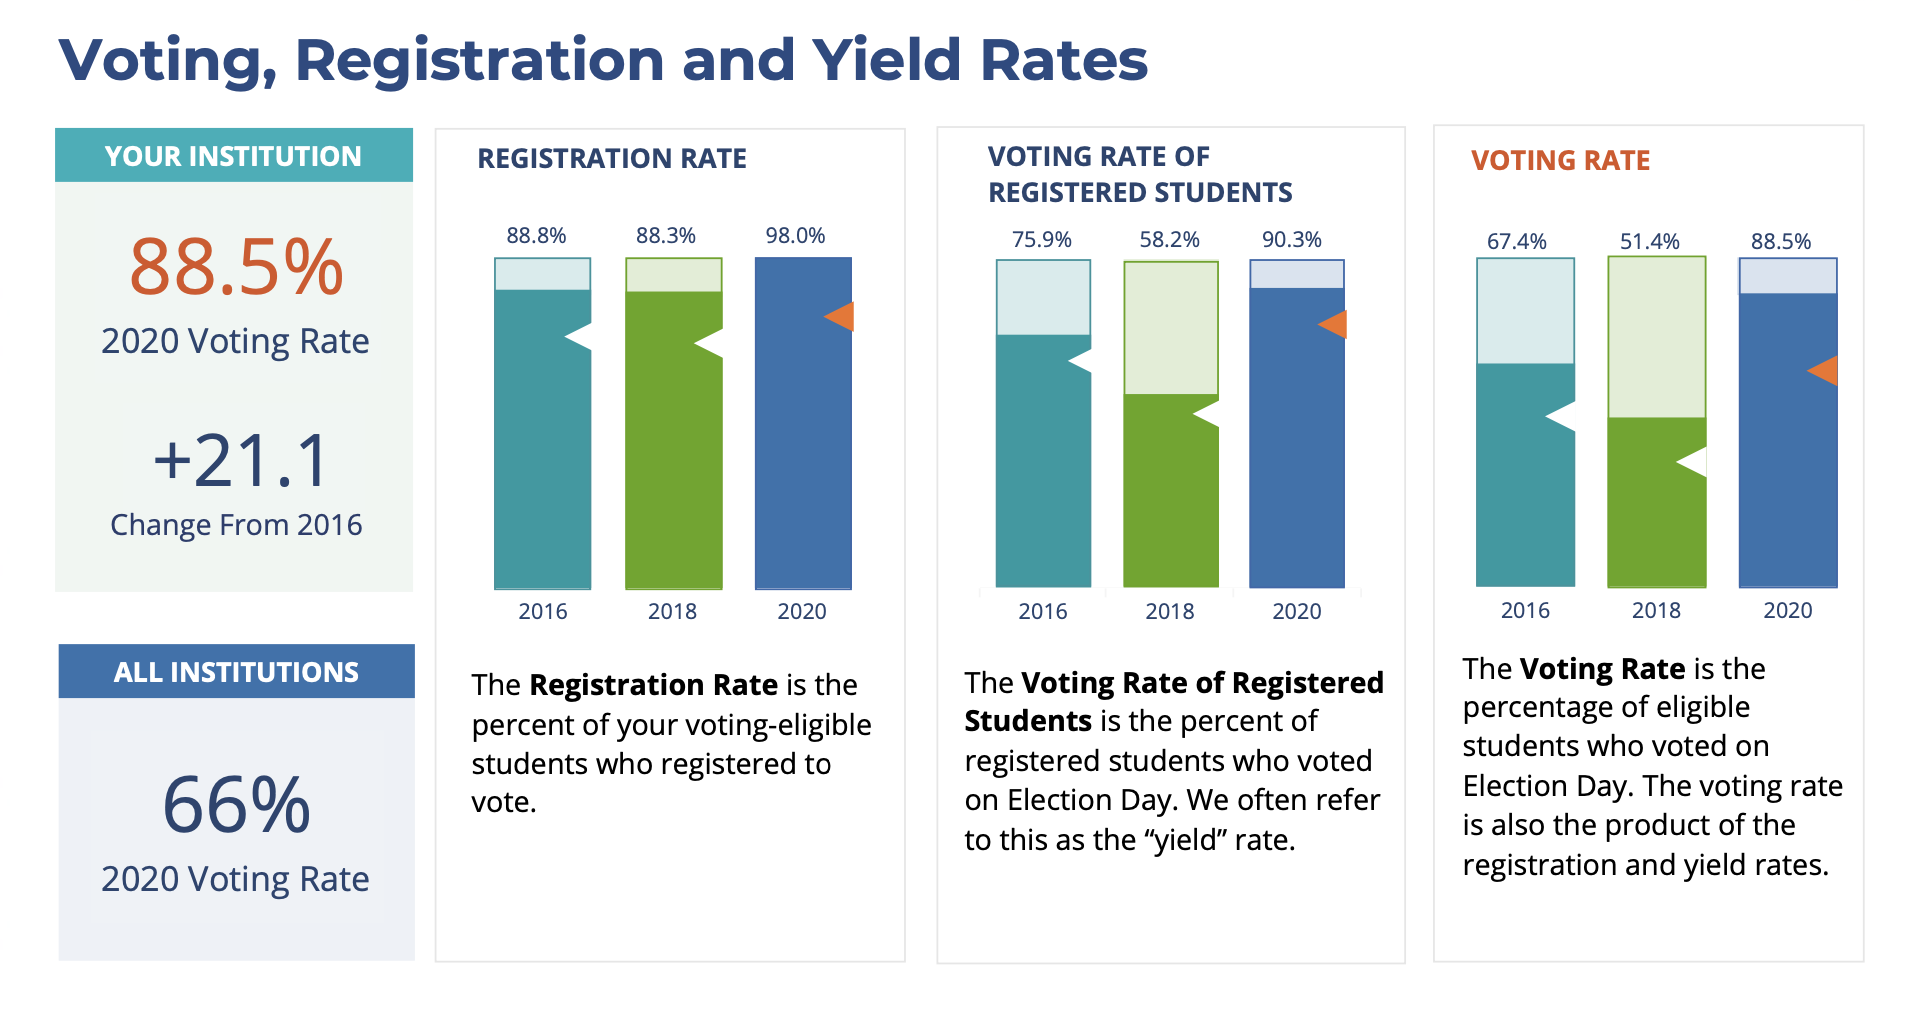
As you can see, 2020 was a landmark year for Davidson at the polls. In four years, Davidson students increased their political participation by over 20%, increased their yield rate by almost 15%, and surpassed the national average for other higher-ed institutions by 22%.3Institute for Democracy & Higher Education: National Study of Learning, Voting and Engagement. (2021). 2016, 2018, and 2020 report for Davidson College. Medford, MA.
Davidson’s 2018 Data
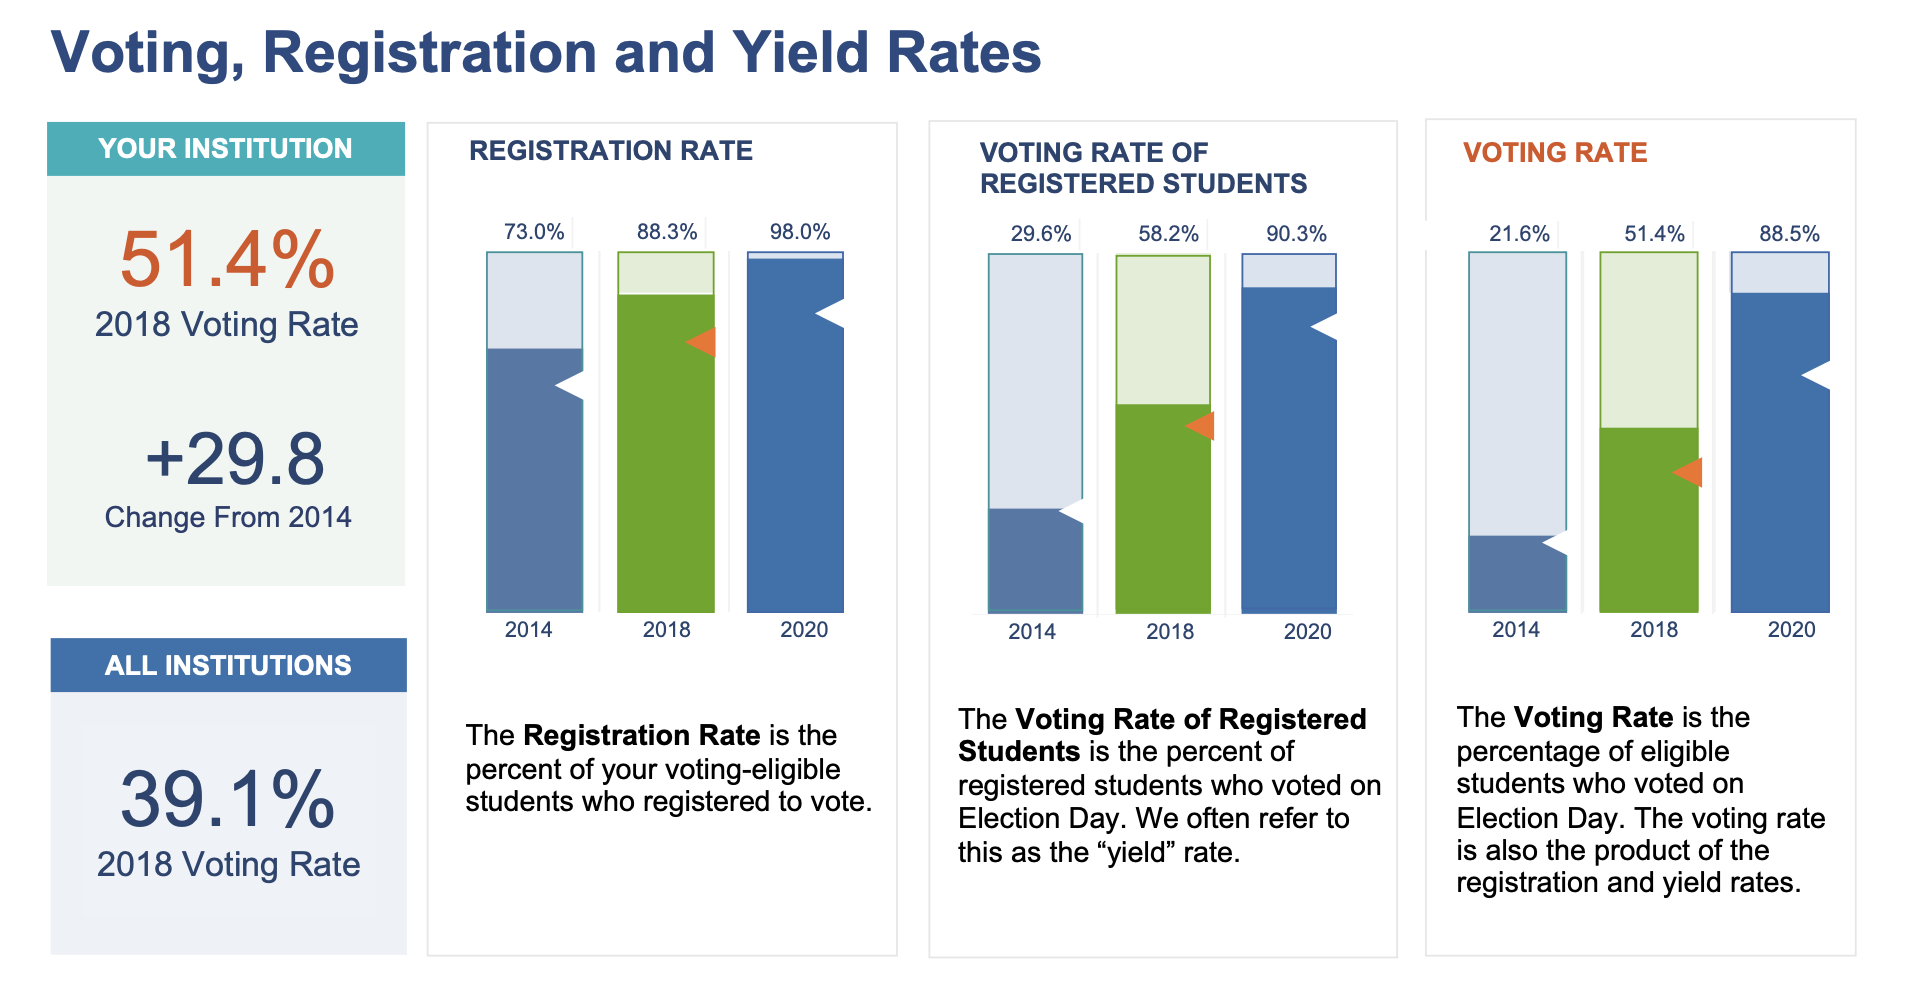
2020 was no outlier. In 2018, Davidson students increased their midterm turnout by almost 30% from 2014, increased their yield rate by almost 30% from the previous midterm, and out-voted comparable cohorts (other institutions) by over 12%.4Institute for Democracy & Higher Education: National Study of Learning, Voting and Engagement. (2022). 2014, 2018, and 2020 report for Davidson College. Medford, MA.
The bottom line is: Davidson students vote at very high rates, not only when compared to broad national averages but also when compared to similar cohorts. This begs the question: what is Davidson doing right? Explore some of the reasons Wildcats are voting at such high rates in our next section explaining these trends.