Dr. Lamoureux-St-Hilaire is an archaeologist specializing in ancient political systems and geoarchaeology. His research is centered on the Classic Maya world, where he’s worked in Mexico, Guatemala, Belize, and Honduras. For over a decade, his work has involved map-making and Geographic Information System (GIS). This summer, he’ll be taking Davidson students to Mexico and Belize to do some fieldwork. Dr. Max also co-organizes the Maya at the Lago Conference, and the 10th installment will take place at Davidson in late April.
Teaching an introductory course for Geographic Information System (GIS) comes with its set of challenges. You must teach how to operate one of the most complex software programs – ESRI’s ArcGIS Pro – while also teaching about a thoroughly interdisciplinary discipline to students majoring in diverse fields. This past semester, for the ANT-377 Imaging the Earth course, I decided to emphasize a few key topics including (1) how to ask questions about landscapes; (2) how to tie complex datasets to diverse landscapes; (3) how to create clear maps to answer these questions; and (4) how to adequately report this scientific inquisitive process.
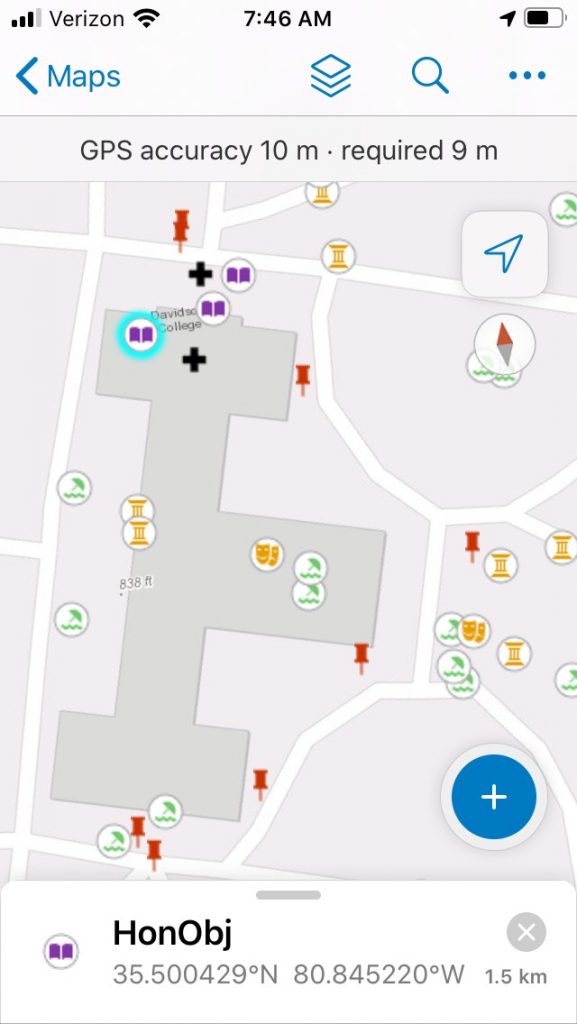
The best way to learn a scientific process is to learn it from beginning to end. In the case of GIS, this begins with collecting data – something that used to require a fairly complex technological setup – e.g., high resolution GPS, total station, etc. Thankfully, the new ArcGIS Pro software comes with a sister app, Collector, which uses your phone’s GPS to take datapoints. After designing a database, I asked the students to roam the Davidson campus to collect basic information about trees, benches, garbage bins, trash, art, and “honored object” (i.e., objects left lying around by students because of the honor code). Over the course of three weeks, the 16 students and myself recorded the GPS location and basic information (characteristics, height, etc.) of 447 features on campus.

This process gave the entire group the opportunity to create an original dataset from scratch, which was then available for analysis and reporting (later this week, look for the companion blog entry by Edman and Stearns). Using opensource Lidar data for Mecklenburg County, I asked students to project these features onto a detailed Digital Elevation Model (DEM) of the Davidson Campus. These combined tasks led students to autonomously combine vector (the geodatabase) and raster (the DEM) GIS data – the two types of datasets handled by GIS specialists.
Using Collector to create a basic geodatabase effectively led students to appreciate their campus from a GIS angle. In addition, the following steps of this exercise allowed them to apply analytical and technical display techniques learned in class to their collaborative dataset. This project was their great first foray into the GIS process, which paved the way to their own personal projects; all of which involved far larger datasets generally obtained online.

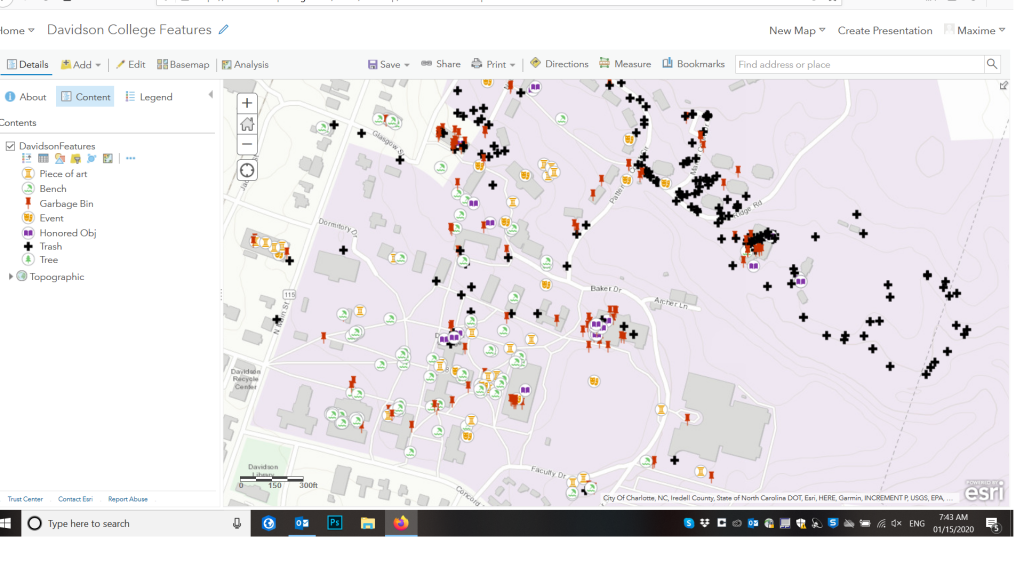
Figure 2. In addition to Collector and ArcGIS Pro, ESRI has an online platform – arcgis.com – which allows you to visualize, query, and modify some of your maps and to produce simple displays such as this one.
GIS technology is challenging because of the thousands of disciplines it is used for, from archaeology and engineering to agriculture and military science. Yet, this exercise proved to be an excellent pedagogical tool to allow students to familiarize themselves with each step involved in the creation of a geodatabase, its analysis, rendering, and presentation. Developing this exercise (especially adequately setting up the database) was also a learning process for me, and I’m excited to continue developing this exercise in the future. Instead of 447 features, I hope to reach 1,000 in next fall’s iteration of this exercise for Imaging the Earth. In particular, I hope to study in more details the distribution of “honored objects”, which reflect a rich idiosyncratic dimension of Davidson’s academic life.

Speak Your Mind