How Big is Lake Norman Worksheet (pdf)
How Big is Lake Norman Worksheet (doc)

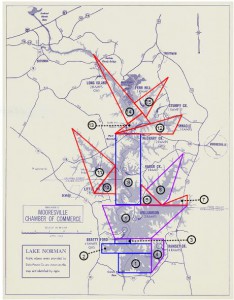
Lake Norman 1963 Measuring Map


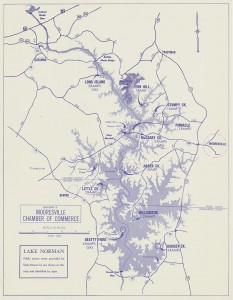
(Original-No Markings)
1963 Lake Norman Map (Original)
Standards:Solve real-world and mathematical problems involving area, volume and surface area of two- and three-dimensional objects composed of triangles, quadrilaterals, polygons, cubes, and right prisms. Solve problems involving scale drawings of geometric figures, including computing actual lengths and areas from a scale drawing and reproducing a scale drawing at a different scale. Theme:Under the Lake {Lake Norman} (45 – 70 mins) Lesson Topic:Identify, define, estimate and find composite areas, volume, surface area and the environmental features of Lake Norman. Essential Questions:What is area? What is volume? Objectives:Language: Students will define area, volume, and surface area. Using maps, students will identify, and create geometric shapes to estimate area, volume and surface-area of the Pre-Existing 1949 Catawba River Basin and the Existing Lake Norman (1963 Map). Students will compare areas, volumes and surface-areas to draw conclusions about river/lake growth and analyze lake properties based on environmental factors; rainfall, dry periods, flooding, dam control, etc.… Content: Composite Area, Geometric Figures, Volume, Surface Area, Real World Applications, Scale, Literal Equations. Learning Strategies:Students can gain an understanding of how geometric math concepts; area, volume and surface area factor into local/real-world environments using a mass body of water. Key Vocabulary:
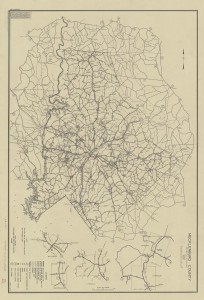
Materials:1949 Catawba River Basin Map (Attached) |
| Lesson Time: 45-70 Minutes
Introduction/Warm-up: (Building Background) Engage students about having traveled to Lake Norman. Using 1949 map or 1963 map and “How Big is Lake Norman” worksheet, have students complete part 1 to engage student participation. Discuss the history of Lake Norman (Here), and get student’s ideas about lake features and history. Students should have familiarity with finding areas of rectangles, triangles and trapezoids using dimensions of length, width and height and calculating sums of composite areas as well as volume of cubes. Explain to students they will be comparing the growth of Lake Norman by evaluating its original form (1949 Map) to its current form (1963 Map).
Guided Notes/Presentation: (Language and content objectives, comprehensible input, strategies, interaction, feedback) After completing the introduction, pass out or direct students to 1963-Shapes Map. At this point introduce or re-loop vocabulary to students so they have an understanding of mathematical terms in respect to environmental features. Familiarize students with measuring distances on maps. Explain that maps have scales and scales convert a paper distance to an actual real-world distance. The table provided allows for students to measure map in inches and then convert to miles/feet/gallons (to accommodate for scale). Show or guide students to 1949 map to show the original river’s layout and compare to 1963 map and how the layout was changed. Explain directions and if needed work example problem to demonstrate to students calculation of area and volumes. Using a ruler, measure the dimensions of area and list those dimensions into the table (Reference 1963 Measuring Map). Repeat one more time if necessary and total composite areas, then have students start part 2 on worksheet. Use worksheet and map to help students connect that real world situations and their local environmental have a foundation in mathematics (geometry, numbering and quantity, and algebra). Practice/Application: (Meaningful activities, interaction, strategies, practice/application, feedback) Using maps, and possible internet access, students should complete worksheet after guided practice from teacher. Students will gain a further understanding of geometric properties such as scale, composite area, surface area and volume. Review/Assessment: (Review objectives and vocabulary, assess learning) Use critical thinking questions and vocabulary to gauge student’s understanding and real-world connection of environmental features and mathematical concepts (Scale, Geometric properties, area, volume, Algebra).
|
