Despite rapid development around the lake, pollution levels have remained acceptable in Lake Norman. Our group analyzed pollution trends of Chlorophyll A, Arsenic, Cadmium, Lead, Mercury, Total Phosphorus, and Fecal Coliform from 1980 to 2014. Despite our initial hypothesis, pollution levels have steadily decreased as a result of greater cleanup efforts, monitoring programs, erosion controls, and governmental regulations. For example, in 1992, North Carolina passed a law requiring local governments to develop watershed regulations to address three major issues: development density, buffer widths, and land use. As the population continued to grow and concern over water quality increased, environmental organizations developed to monitor pollution and educate the community. A timeline that tracks the environmental action concerns and non-profit developments around Lake Norman can be found at: https://davidsonarchivesandspecialcollections.org/uln/ngo/ .
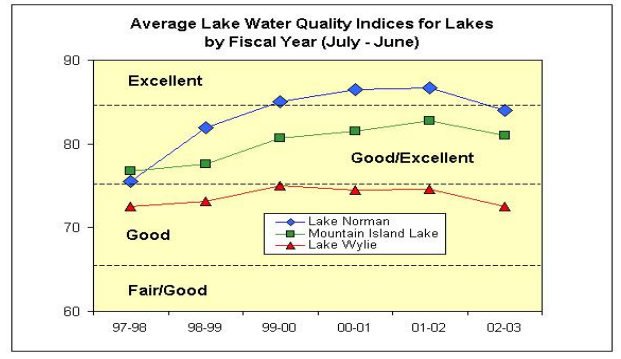 http://charmeck.org/stormwater/creekslakesponds/Lakes/Documents/MOUGuidelines.pdf
A Few Key Indicators of Water Health:
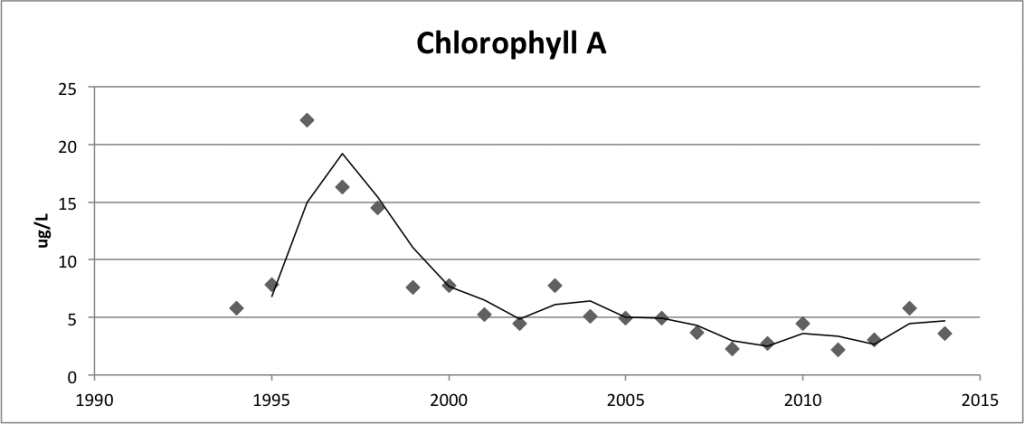
Chlorophyll A is the perhaps the best indicator of ecosystem health. In Lake Norman numbers have declined to numbers that allow for the functioning of a healthy ecosystem.
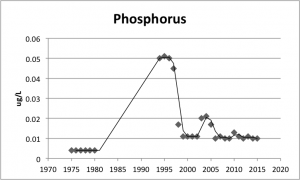
Phosphorus levels have increased by only .01 ug/L.
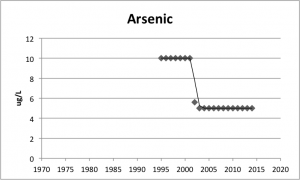
Arsenic levels have decreased.
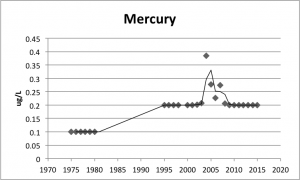
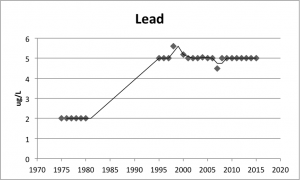
Levels of mercury and lead have increased in the lake, however they have not done so at rates that pose any immediate risk and their levels have stabilized over the past decade. Heavy metals like mercury and lead have the potential to bioaccumulate in fish. This means that levels of heavy metals in fish could be much higher than in the lake itself. We need to keep an eye out for heavy metals like mercury and lead.
(data from Duke Energy and Charlotte-Mecklenburg Storm Water Services)
